Cvent CONNECT 2026: Everything Announced (Living Roadmap Tracker)
Quick Answer
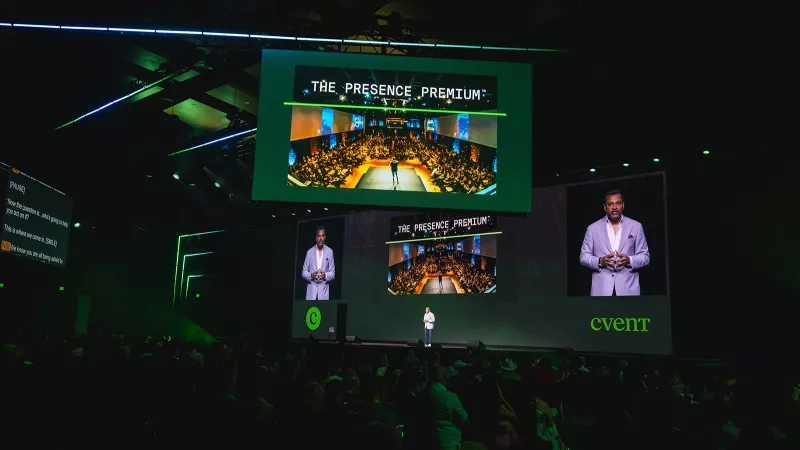
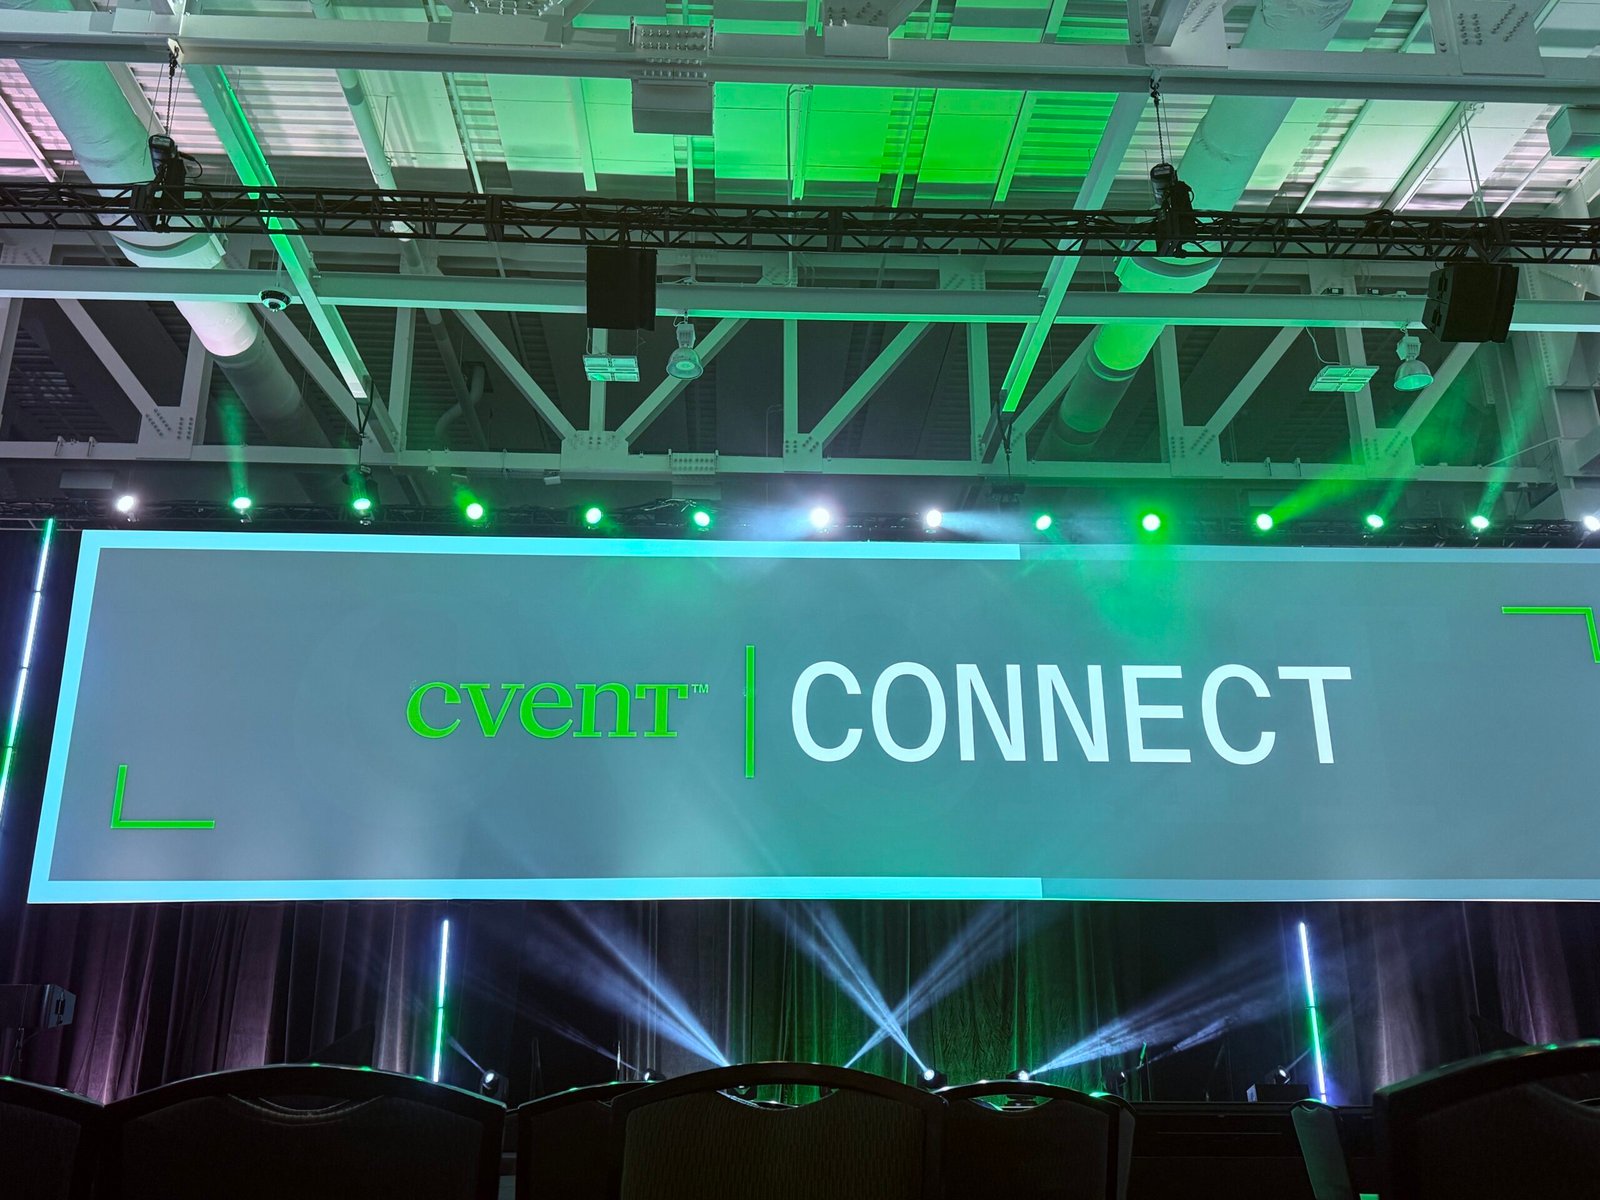
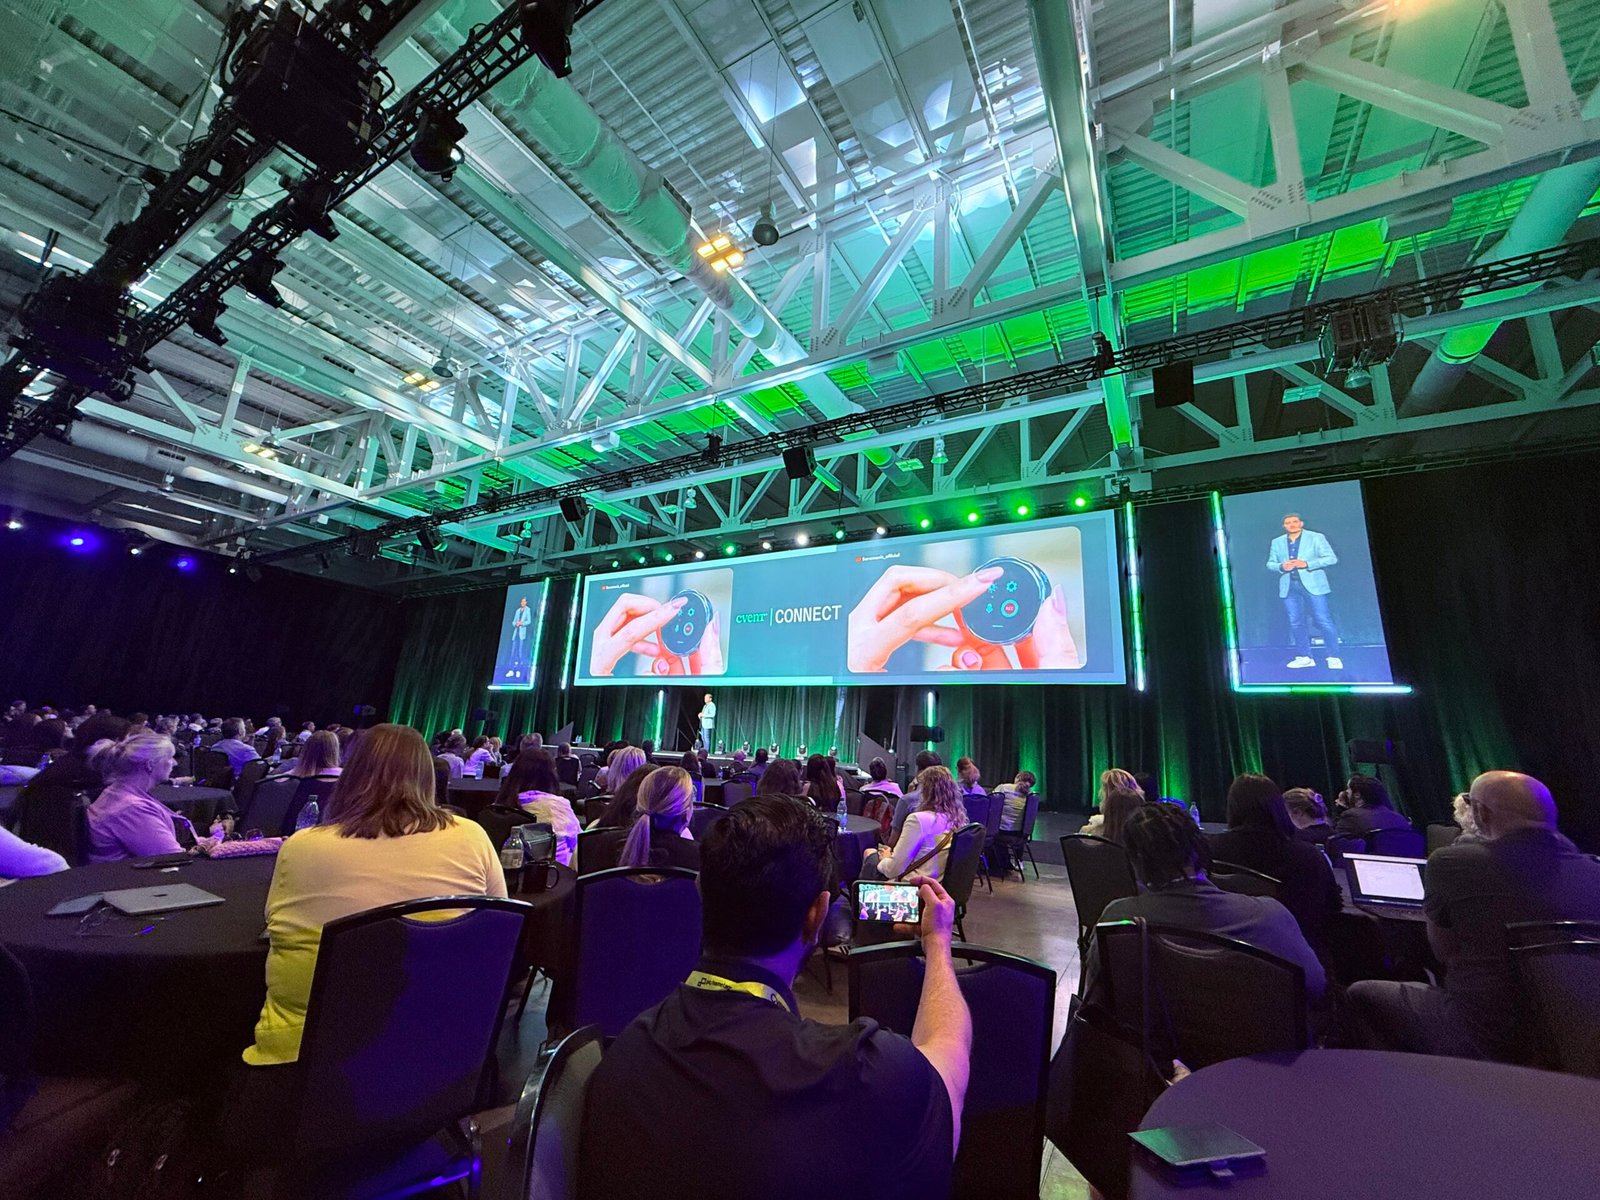
Cvent CONNECT 2026 took place July 14 in Nashville, where Cvent announced more than 70 product innovations — including 34 new AI capabilities — backed by a $1 billion multi-year investment and a full company rebrand centered on “the Presence Premium.” Not everything announced is live yet. Some capabilities shipped immediately, others entered beta in the weeks after the keynote, and several remain scheduled for Q3 and Q4 2026. This page is the single, continuously updated source of truth for what’s actually available right now — with links to our full breakdown of every major piece.
The Master Status Table
We verify this table against Cvent’s own release notes, not just the keynote press release, since the two don’t always agree on timing.
🟢 Live now
| Capability | Category | Notes |
|---|---|---|
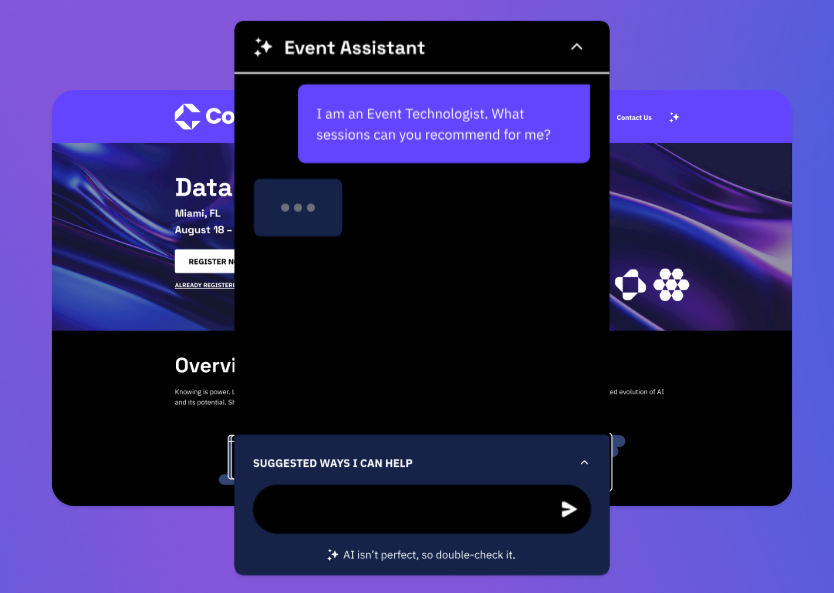
| Attendee AI Assistant | Marketing | Embedded in Attendee Hub |
| Global Profiles & Discovered Interests | Marketing | No setup required |
| Snapshots, Session Takeaways, Audience Insights | Marketing | Zero-config content analytics |
| Network Builder | Marketing | Depends on attendee profile data quality |
| AI Sourcing (venue search) | Hospitality | Natural-language venue shortlist |
| AI Powered BYOR (reporting) | Reporting | Conversational report building |
| Event Theming | Marketing | Live |
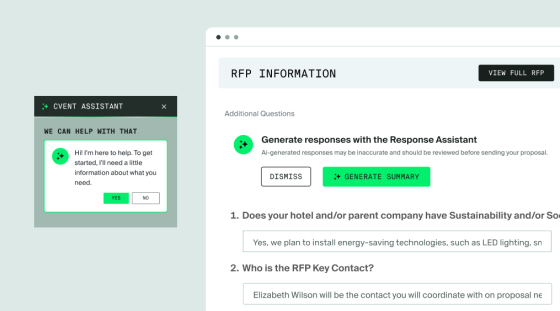
| Cvent Assistant — Support / Knowledge Base | Organizer | Open beta, all customers, since May 2026 |
| Cvent Assistant — Insights capability | Organizer | Open beta |
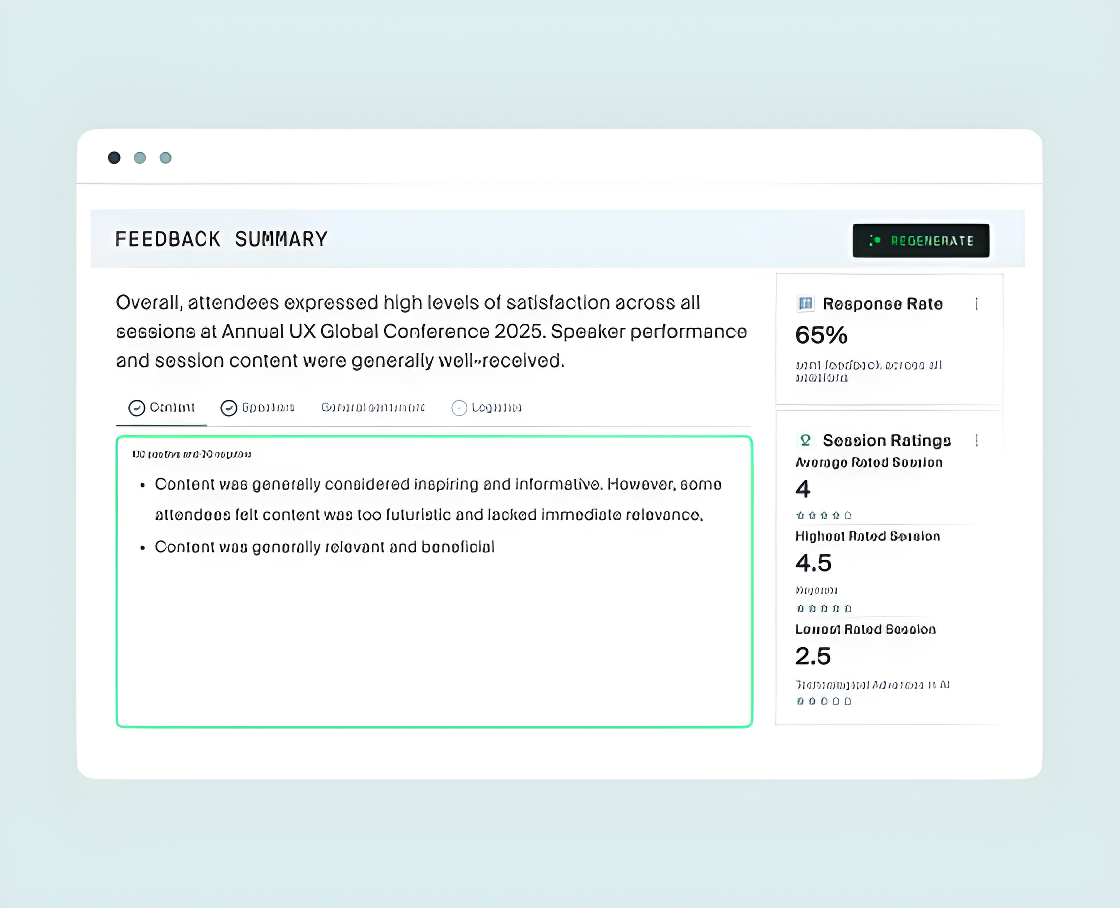
| Cvent Assistant — Survey Feedback Insights | Organizer | Open beta |
| Attendee Assistant | Attendee Hub | Live |
| AI RFP Builder | Hospitality (CSN) | Live |
| AI Seating Assistant | Hospitality/Diagramming | Beta, Diagramming customers |
| Rooming List Assistant | Hospitality (Passkey) | Live, standalone update |
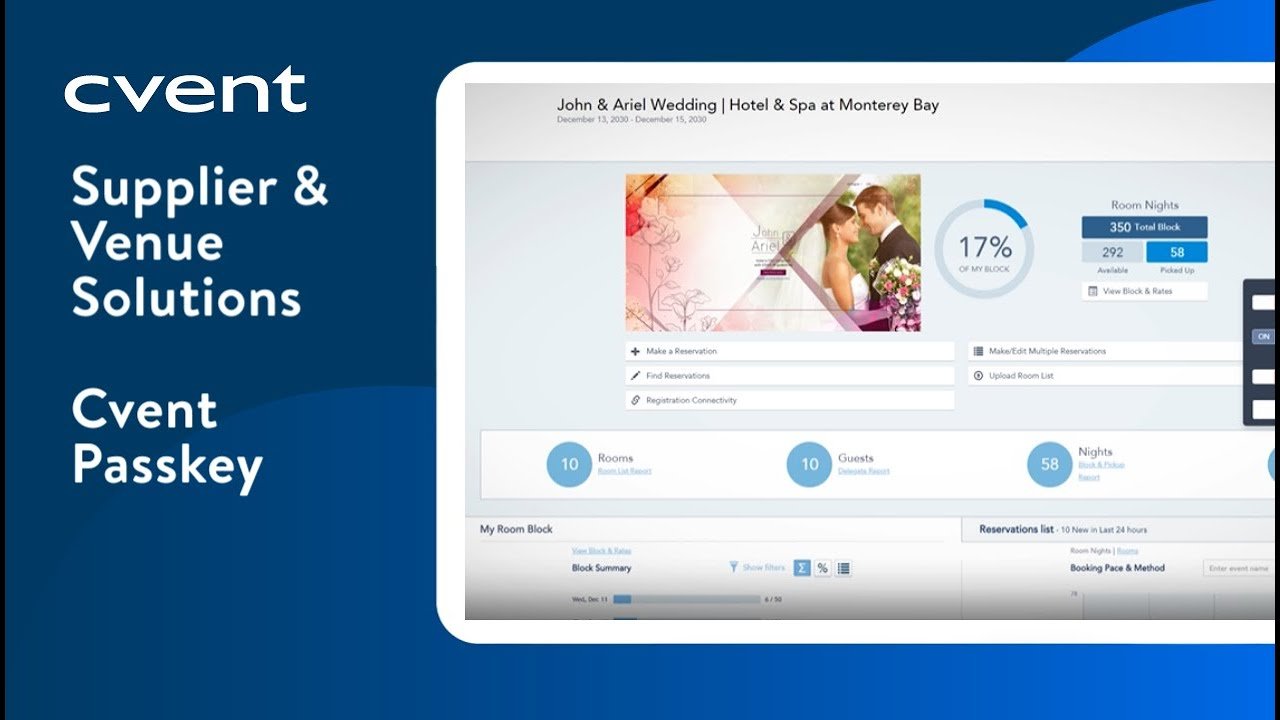
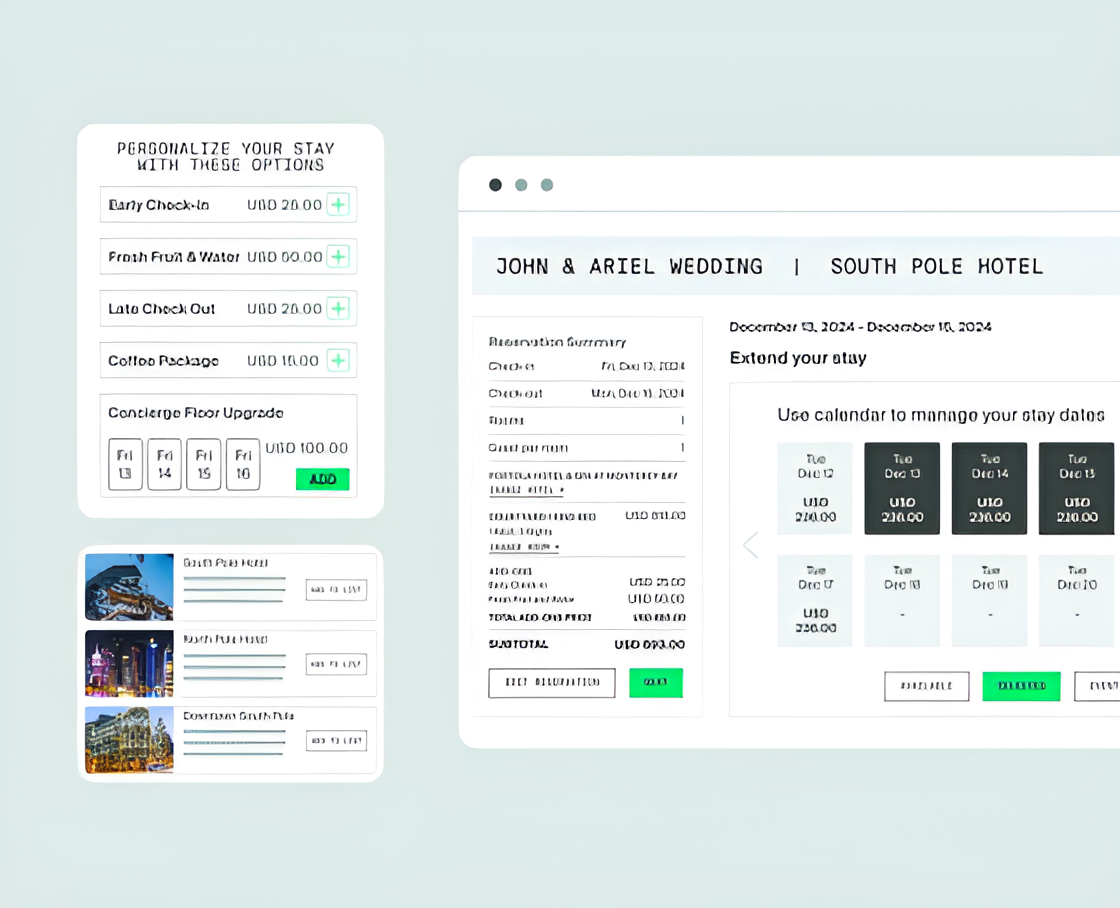
| Multi-hotel group bookings | Hospitality (Passkey) | Live, standalone update |
🟡 Beta started July 2026
| Capability | Category | Notes |
|---|---|---|
| Registration Setup capability | Organizer | Conversational registration builds |
| Attendee Management capability (narrower) | Organizer | Retrieve details, registration changes, agenda updates |
| Agenda Builder | Marketing | Needs full session catalog tagged correctly |
| Warm Introductions | Marketing | Beta |
| Exhibitor Recommendations & Lead Follow-Ups | Marketing | Beta |
| BI Reporting Assistant | Hospitality | Beta |
🔴 Confirmed for Q3 2026
| Capability | Category | Notes |
|---|---|---|
| CventIQ Skills | Platform | Headless — works through Claude, ChatGPT, Salesforce Agentforce |
| Cvent Assistant — Event Creation | Organizer | Full branded draft from uploaded documents |
| Cvent Assistant — full Attendee Management flow | Organizer | Paste an email, one-click execute everything |
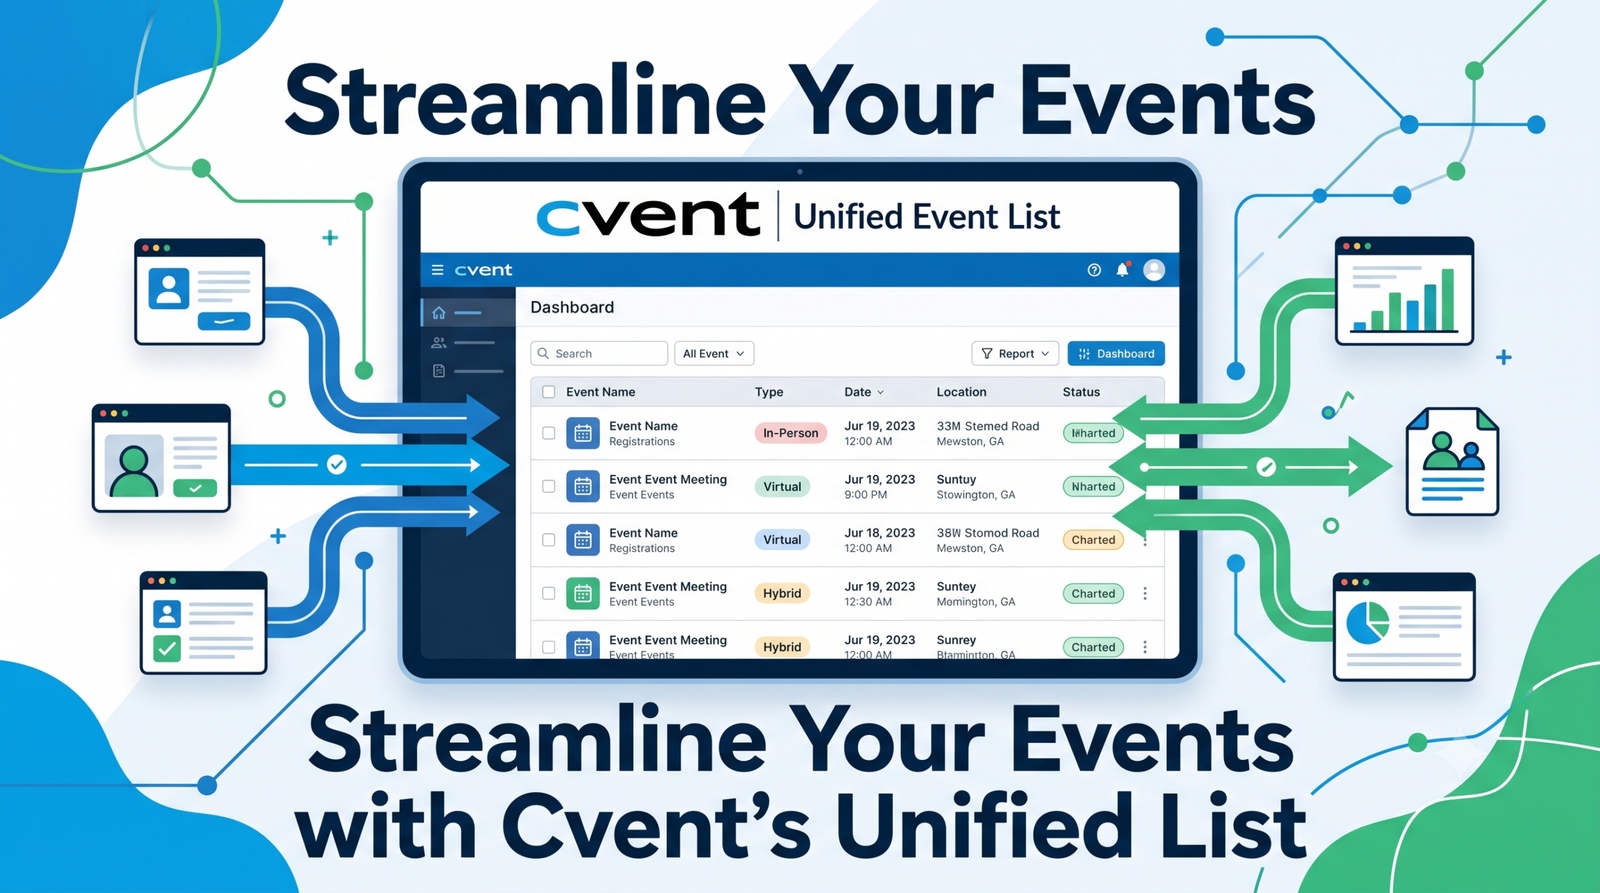
| Unified Event List & Navigation | Organizer | Every event type, one record |
| AI Content Assistant | Hospitality | Supplier profile scoring |
| Planner Navigator enhancements | Hospitality | Q3 2026 |
| Response Assistant enhancements | Hospitality | Q3 2026 |
🔵 Confirmed for Q4 2026
| Capability | Category | Notes |
|---|---|---|
| Program Knowledge Base | Organizer | Org-wide SOPs feed the Assistant |
| Essentials AI End-to-End | Field marketing | Full field events via prompt |
| Cross-format Budget Tracking | Finance/Ops | Across all event types |
| Event Diagramming updates (3D Designer) | Hospitality | Q4 2026 |
⚪ Rolling, no fixed date
| Capability | Category | Notes |
|---|---|---|
| Passkey end-to-end room block overhaul | Hospitality | “Multiple enhancements through end of 2026,” unconfirmed specific dates |

How We Keep This Page Accurate
Most CONNECT 2026 coverage repeats Cvent’s own press release, which buckets many capabilities under one simplified “Expected Q3 2026” label. That framing is good enough for a headline, but not precise enough to plan a rollout around. We cross-check three sources before anything on this page changes status:
- Cvent’s flagship press release — the headline announcement, useful for scope but not for precise timing.
- Cvent’s own release-notes board (release.cvent.com) — where individual capabilities get their real beta dates, often ahead of what the press release implies.
- Independent reporting — trade press covering live demos and keynote reactions catches details neither Cvent document states outright, like which capabilities got a standing ovation specifically because they haven’t shipped yet.
When these three sources disagree, we follow the most granular and most recent one, and we say so. That’s why several items on this page show as “live now” even though Cvent’s own July 14 press release listed them as “Expected Q3 2026” — the underlying capability had already entered open beta by the time the keynote happened.
Why a Living Page Instead of a Recap
A press release is a snapshot. A single blog recap goes stale the day a beta status changes. This page exists because “everything Cvent announced” isn’t actually one moment — it’s a rollout stretching from May 2026 betas through Q4 2026 launches, and the honest answer to “is X available yet?” keeps changing throughout that window. Bookmark this page specifically because it’s built to keep answering that question correctly, not just on publish day.
Deep-Dive Directory
Every section above links to a full breakdown elsewhere on this site. Here’s the complete set, organized by theme.
Brand & Strategy
- Cvent CONNECT 2026: The Announcements That Actually Change How You Run Events — the full recap, with our honest take on what’s real versus hype.
- Why Did Cvent Rebrand? Event Tech’s Most Powerful Message — the financial story behind the rebrand and what it signals.
- What Is the Presence Premium? — the canonical definition, the data behind it, and our original scorecard.
AI Platform
- CventIQ Explained — the architecture underneath everything: Skills, the Assistant, and how it all connects.
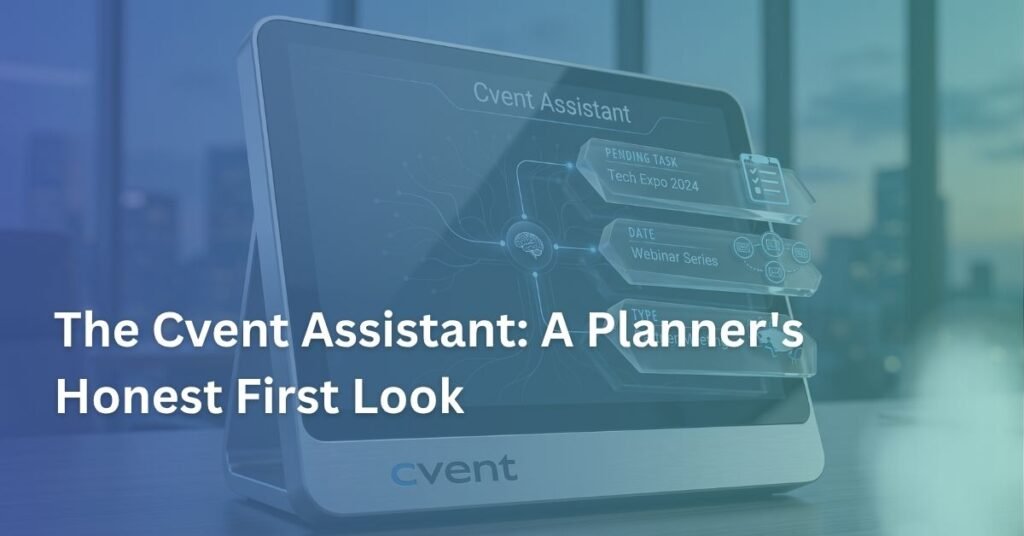
- The Cvent Assistant: A Planner’s Honest First Look — our most detailed, most frequently updated capability-by-capability status tracker.
- The New Cvent AI Tools, Ranked — what to turn on first, by effort versus impact.
Feature Deep-Dives
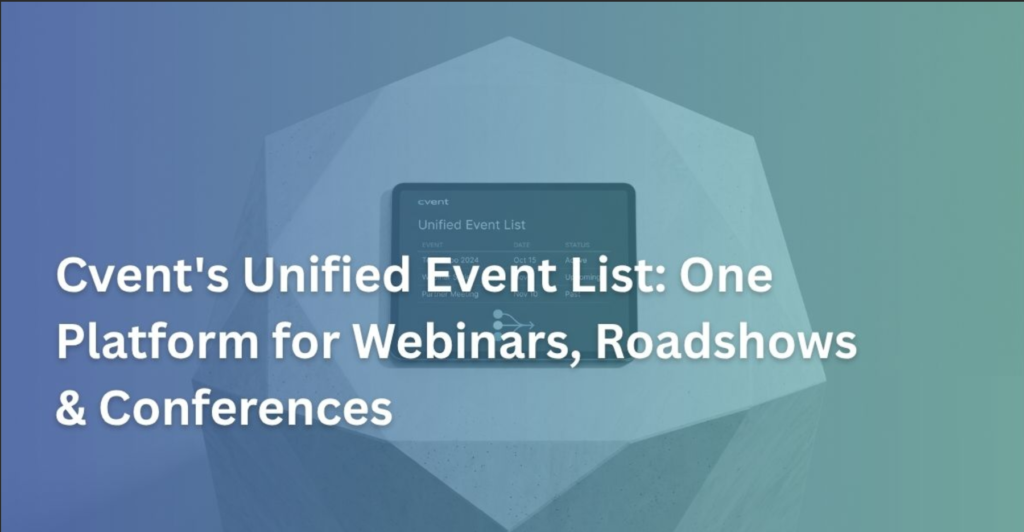
- Cvent’s Unified Event List — the before/after case for consolidating your event stack.
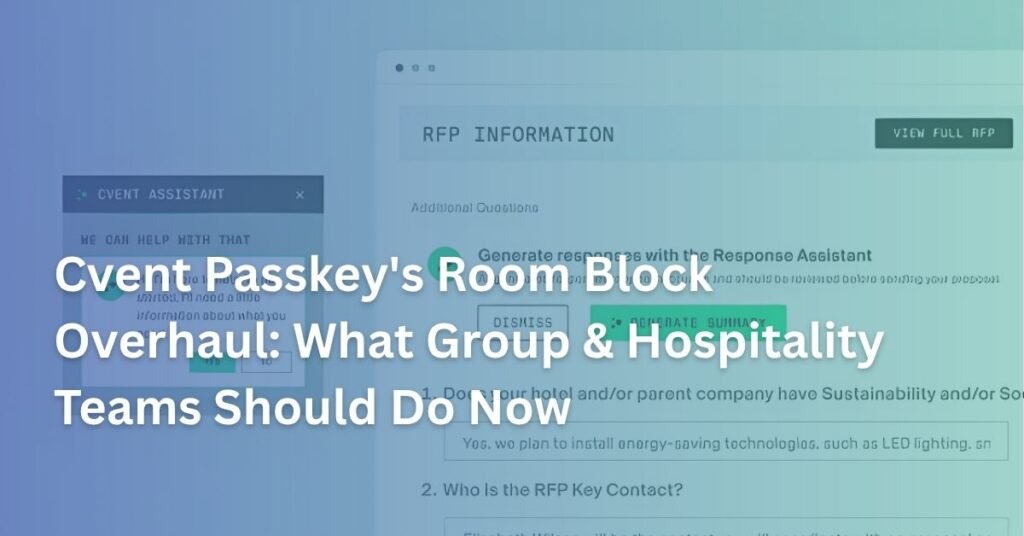
- Cvent Passkey’s Room Block Overhaul — what’s already live, what’s still coming, and how to prep.
Practical Guides
- The Event ROI Framework — how to prove event value to your CFO, built on real industry benchmarks.
- The Cvent Implementation Checklist — a phase-by-phase playbook, including where AI setup fits.
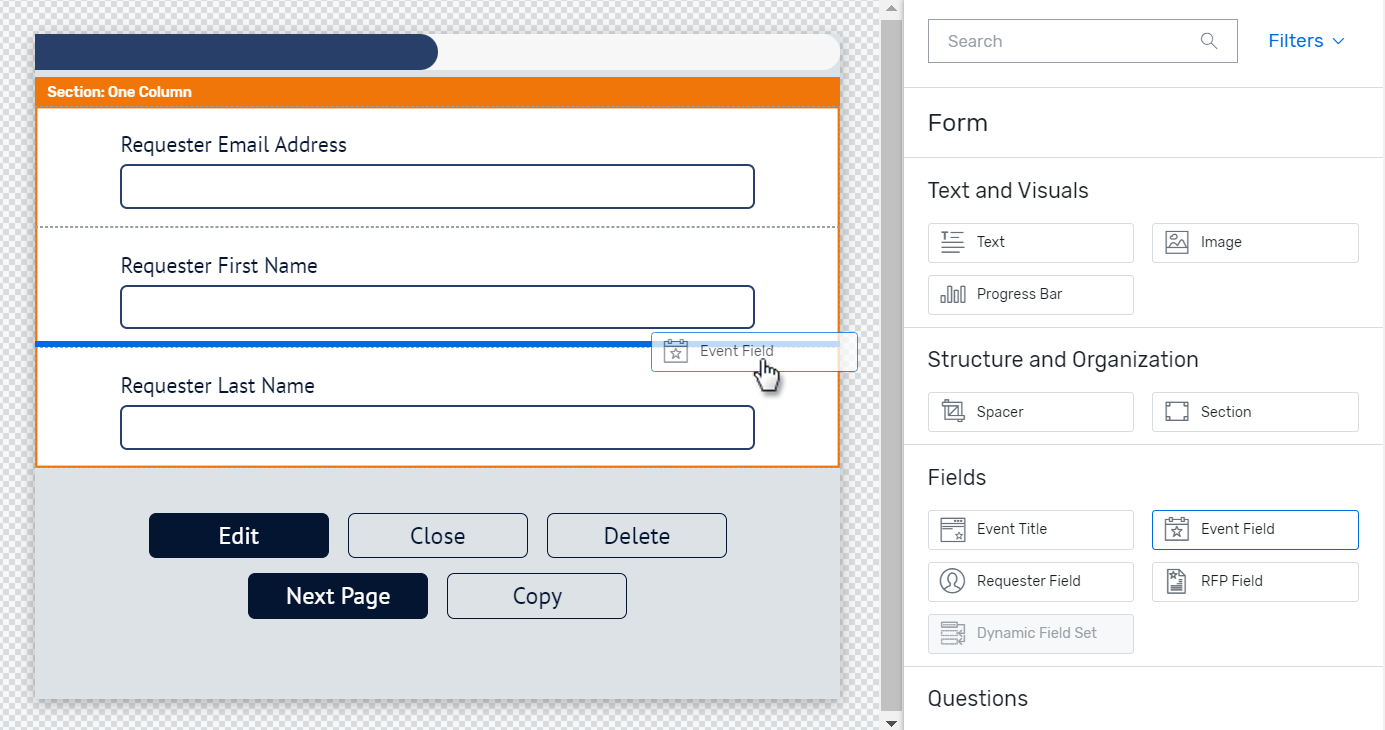
- Registration Conversion in the AI Era — real benchmarks and a field-by-field framework for Cvent forms.
Changelog
- July 24, 2026 — Hub page published. Full status table cross-verified against Cvent’s release notes board and Business Travel News reporting.
- July 23, 2026 — Confirmed Insights capability, Survey Feedback Insights, and AI Sourcing were live in beta, correcting the flagship press release’s blanket “Expected Q3 2026” framing for these items.
- July 20, 2026 — Business Travel News reported the full attendee-management flow (paste an email, one-click execute) is confirmed for Q3 2026, not yet shipped.
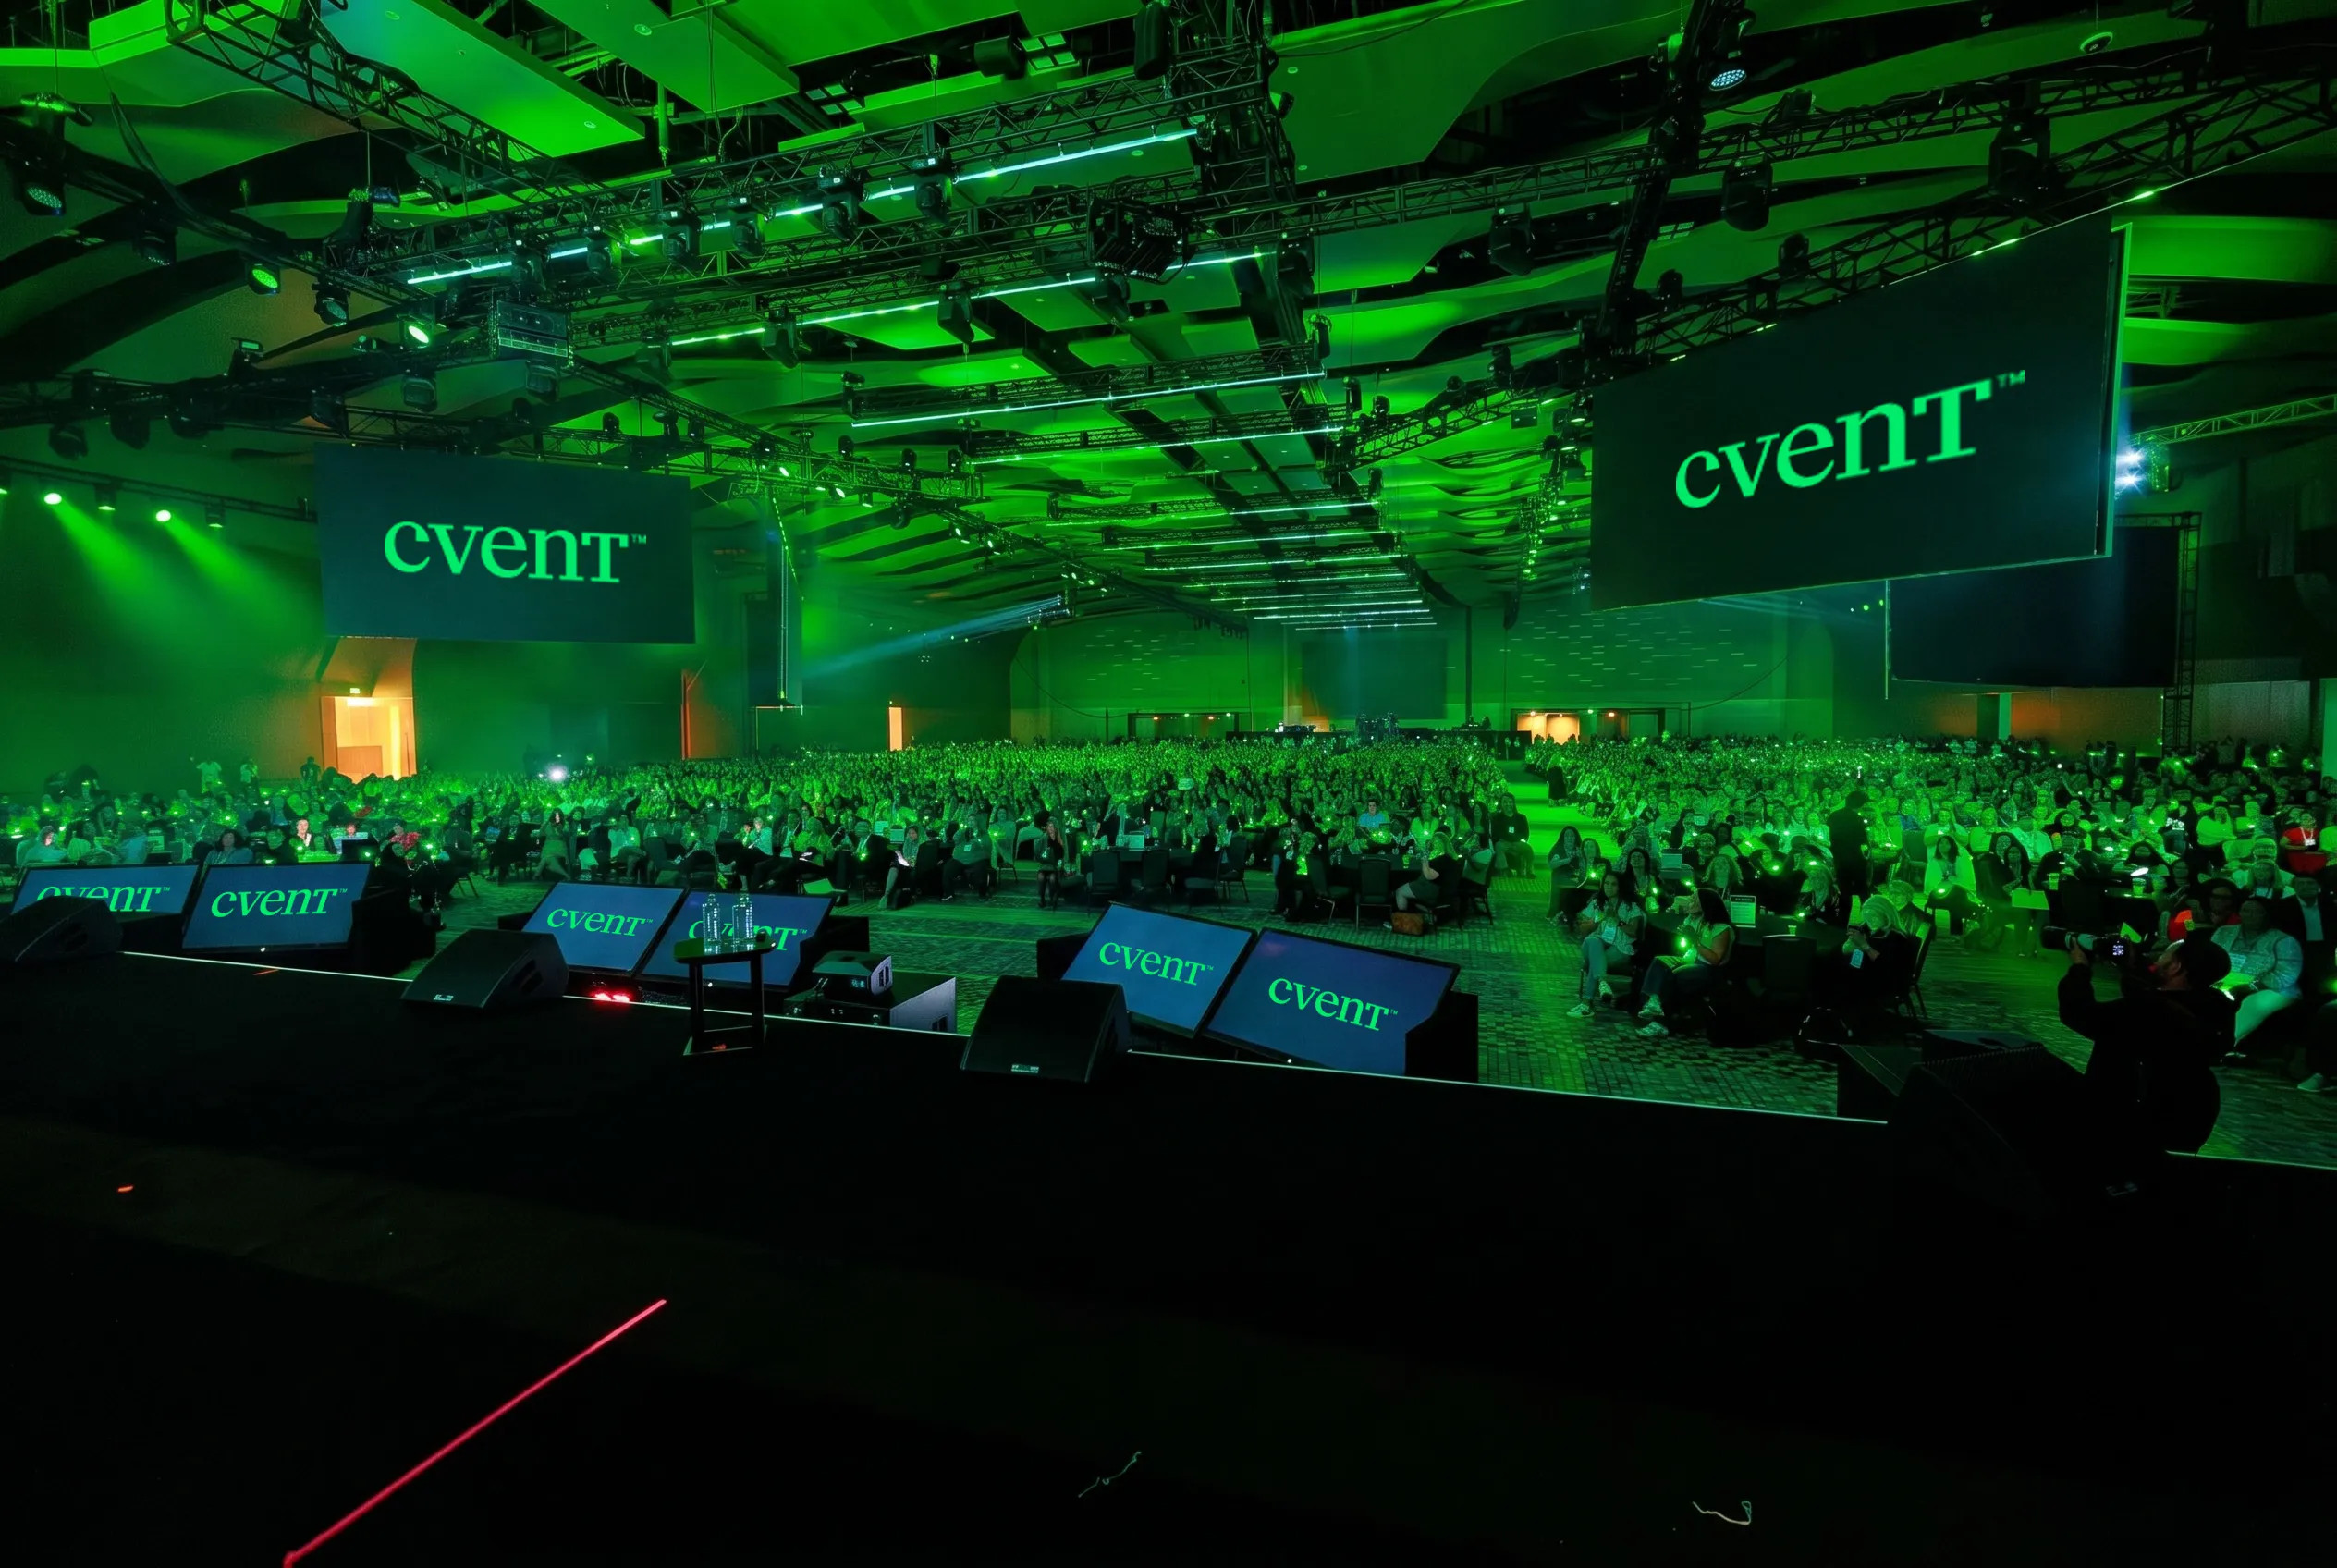
- July 14, 2026 — Cvent CONNECT 2026 keynote in Nashville. 70+ product innovations announced, including 34 AI capabilities, a $1 billion investment pledge, and the company rebrand around the Presence Premium.
- July 6, 2026 — Cvent opened beta enrollment for Registration Setup and Attendee Management capabilities.
- June 10, 2025 — CventIQ originally launched at Cvent CONNECT in San Antonio, the foundation this year’s announcements build on.
This changelog updates as each Q3/Q4 2026 feature ships, moves status, or has its timeline revised. Bookmark this page rather than any single feature announcement — Cvent’s own beta dates are explicitly subject to change.
Stay Updated
New capabilities will move from this page’s Q3 and Q4 sections into “Live now” throughout the rest of 2026. Two ways to stay ahead of it:
- Subscribe to our newsletter for updates the moment a status changes on this page.
- Get a readiness audit. If your team wants to know exactly which of these capabilities are worth adopting now versus waiting on, that’s a conversation, not a table.
FAQs
What was announced at Cvent CONNECT 2026? Cvent announced more than 70 product innovations, including 34 new AI capabilities, backed by a $1 billion multi-year investment. Major announcements included the Cvent Assistant, CventIQ Skills, a Unified Event List, a Passkey room-block overhaul, and a full company rebrand around the concept of the Presence Premium.
Is everything from Cvent CONNECT 2026 available now? No. Several capabilities are live today, others entered beta in July 2026, and several major features — including the Unified Event List and the full Cvent Assistant attendee-management flow — are confirmed for Q3 or Q4 2026. See the status table above for the current breakdown.
How often is this page updated? This page updates as Cvent capabilities move between beta and general availability, or as timelines change. Check the changelog above for the most recent update.
Where can I read more about a specific Cvent CONNECT 2026 announcement? See the Deep-Dive Directory above — every capability links to a full breakdown covering what it does, its real status, and how to prepare for it.
Cvent CONNECT 2026: Everything Announced (Living Roadmap Tracker) Read More »